Quality delivered
[GRI - 103-1],
[GRI - 103-3],
[GRI - 417-1],
[GRI - 417-2],
[GRI - 203-1],
[GRI - 203-2],
[GRI - 102-40],
[GRI - 102-43],
[GRI - 413-1],
[GRI - 419-1],
[GRI - 102-42],
[GRI - 102-44],
[GRI - 103-2],
[GRI - 102-6],
[GRI - 102-49],
[GRI - 303-1],
[GRI - 416-1],
[GRI - 102-40],
[GRI - 303-2],
[GRI - 304-2],
[GRI - 417-1],
[GRI - 102-15],
[GRI - 303-4],
[GRI - 203-1],
[GRI - 103-2],
[GRI - 103-3],
[GRI - 417-2],
Acea oversees the quality of the services provided with interventions aimed at its constant improvement. To this end it trains people and ensure that they attend seminars, applies innovative technology to the management of processes, renews and expands the infrastructure (networks and plants), increasing its resilience, also aimed at the reduction of failures and timely recovery, increases the offer of digital contact channels, complementing the traditional ones and takes care of communication with customers.
The "quality delivered" is also measured via benchmarks defined by the sec- tor authority or indicated in the service contracts and management agree- ments with local authorities, in particular:
- for the Public Lighting service, the contract between Acea and Roma Capitale regulates the qualitative parameters (performance standards);
- the technical and commercial quality standards in the energy sector (for both distribution and sales) and the contractual and technical quali- ty standards in the integrated water service are defined and updated by the Energy, Networks and Environment Authority (ARERA) and, for the water sector, also by the local authorities.
The main regulatory interventions by ARERA in 2021 for the electricity and water sectors are summarised in the Group profile, in the paragraph “Context analysis and business model”, to which reference should be made. In addition to complying with the quality standards laid down by the regula- tion, Group companies operate in accordance with UNI EN ISO certified management systems based on a rationale of continuous improvement (see also Corporate identity, in the paragraph Management systems).
QUALITY IN THE ENERGY SEGMENT
This section illustrates the quality aspects relating to electricity distribution services in the municipalities of Rome and Formello, and public lighting in the municipality of Rome, both managed by Areti49, while for electricity and gas sales, managed by Acea Energia, see the section on Customer Care.
The Company operates in compliance with the QESE (Quality, Environment, Safety and Energy) Management System for both the construction and management of distribution infrastructure and Public Lighting.
The distribution of electricity

Areti plans and carries out the modernisation and expansion works on the electricity distribution network, consisting of high (HV), medium (MV) and low (LV) voltage power lines, primary and sec- ondary substations, and systems for the remote control and meas- urement of energy drawn from and fed into the grid. The interven- tions take into account the objectives established by the national authority (ARERA), the progressive evolution of electricity appli- cations, the increase in "prosumers"50, new connections, etc., and aim to make the infrastructures increasingly resilient, with an ad- equate and enabling network configuration for future scenarios, such as widespread electric mobility and progressive electrification of consumptions.
The integrated development of the electricity grids is defined in the Master Plans for the HV, MV and LV networks, which Areti imple- ments through construction - and also decommissioning or dem- olition, and consequent containment of environmental impacts, in specific areas-, transformation, modernisation, maintenance, etc. (see Table 18). The interventions carried out each year are aimed at rationalising and upgrading the networks, increasing transport capacity and margins for further use, increasing their adaptability and reducing network losses and voltage drops, improving service continuity.
In 2021, as part of the implementation of the Resilience Plan51, 122 km of medium voltage cable at 20 kV were upgraded and 98 sec- ondary substation renovations were carried out to increase their resilience to the critical factor of "heat waves", and 36 secondary substation renovations were carried out to increase resilience to the critical factor “flooding”. For the LV networks, 118 km were put in place as part of the overall network modernisation programme, in preparation for the subsequent voltage change from 230 V to 400 V. Remote control was extended to additional secondary sub- stations and reclosers, for a total of 7,582 remote-controlled MV nodes at 31/12/2021.
Table no. 18 – Main interventions for the management and development of electricity grids and substations (2021)
| type of work | HV lines and primary substations (PSs) |
|---|---|
| Demolition of grid and supports | work continued on the dismantling of high-voltage lines, which had been taken out of service, leading to the removal of a total of 48 pylons of the 150 kV and 60 kV lines; a total of 7.2 km of 150 kV high-voltage lines in fluid oil underground cable (Belsito-Tor di Quinto and Belsito-Monte Mario/F sections) were decommissioned. |
| Construction of grid and supports | construction began on the new section of the 150 kV Selvotta - Castel Romano overhead line (5.8 km long and comprising 24 supports); construction continued on the new section of the 150 kV North Rome - San Basilio underground cable line (3.4 km long); new 150 kV XLPE (cross-linked polyethylene) underground cables were put into service to replace the above-mentioned cables that had been decommissioned (7.2 km of the Belsito - Tor Di Quinto and Belsito - M. Mario/F sections). |
| Station upgrading, expansion, renovation | interventions were carried out in 51 primary substations; at the PS. Belsito was put into service the new HV 150kV hybrid switchgear |
| Ordinary and extraordinary maintenance on PS station equipment | interventions were made on 106 high-voltage circuit breakers and 784 medium-voltage circuit breakers were maintained; 16 on-load tap changers of power transformers were overhauled and 63 high-voltage measuring transformers were replaced; power transformers at the Appio primary substation and the ATR transformer at the Flaminia Receiver were also replaced. |
| HV and MV protection and measures | |
| Remote management | the following were prepared, calibrated and put into operation 78 new MV line bays; checked 327 posts (57 HV posts and 421 MV posts) and 43 transformers (between HV/MV and MV/MV). |
| measures | earth resistance measurements were carried out on 2,350 secondary substations; step and contact voltages and total earth resistance measurements were conducted on 12 substations (5 primary and 7 secondary). |
| MV and LV lines | |
| Modernisation and upgrading of MV networks (transformation from 8.4 kV to 20 kV) and LV networks (transformation from 230 V to 400 V) | 196 km of 20 kV MV cable (22 km for expansion and 174 km for upgrading), including 122 km to increase resilience to heat waves, and 192 km of LV cable (74 km for expansion and 118 km for upgrading in preparation for voltage changeover) were installed. |
| ordinary and extraordinary maintenance | heloborne inspections were carried out for an extension of the overhead MV network equal to 170 km, in order to carry out specific interventions to replace equipment, supports, conductors, etc. necessary for the preservation and maintenance of the functionality of the systems. |
| secondary substations (SSs) and remote control | |
| construction, extension, reconstruction SS | 835 secondary substations were built/upgraded/rebuilt (190 for new connections or power increases, 645 for upgrading to 20 kV, renewing equipment, setting up remote control), of which 134 substations were rebuilt to increase resilience to "heat waves" (98 substations) and "flooding" (36 substations). |
| ordinary and extraordinary maintenance on SS | 1,019 extraordinary maintenance operations and 2,067 inspections on secondary substations were carried out |
| remote control | remote control was extended to 335 secondary substations and 394 reclosers (7,582 MT nodes were remote controlled at 31/12/2021) and 4,664 maintenance operations were carried on TLCs and reclosers. |
In 2021, Areti carried out interventions to protect the primary and secondary substations, as part of the activities aimed at raising the levels of security for the protection of infrastructures from cyber risks, integrated technological solutions have been implemented to protect field equipment and detect any vulnerability of industrial network protocols. In addition, Quick SIEM and Blue Team ser- vices were strengthened to monitor the network infrastructure and manage incidents, ensuring security oversight in view of the estab- lishment of the Security Operation Center (SOC). Analyses were started to identify additional technological solutions for upgrading the existing technological security system. See also the chapter Institutions and Business for an in-depth analysis of research and innovation and the projects implemented in the year.
Following the launch, in the last quarter of 2020, of the plan to massively replace first-generation (1G) meters with second-gener- ation (2G) ones, which will progressively affect the entire managed territory, in 2021 Areti installed a further 316,176 2G meters; the new meters encourage greater customer awareness of consump- tion, thanks to the data available, and a reduction in estimated bill- ing.
The total number of remote-controlled meters (1G and 2G) in- stalled on low-voltage active users at 31/12/2021 is 1,646,739.
Public LIGHTING

Areti manages, by virtue of the Service Agreement52 between Acea SpA and Roma Capitale, works on the functional and artistic-mon- umental public lighting infrastructures, for about 201,200 light- ing points located on a territory covering about 1,300 km2.
The company handles the design, construction, operation, main- tenance and renovation of lighting networks and installations, and plans interventions in accordance with the instructions of the local government departments and supervisory departments, which are responsible for new urban developments, redevelopment projects and cultural heritage.
In addition to the service provided to Roma Capitale, Areti also makes public and artistic lighting services available to other stake- holders (e.g. ecclesiastical bodies, hotels, etc.).
Table no. 19 – Public lighting in Rome in figures (2021)
|
lighting points (no.) - monumental artistic lighting points (no.) |
201.215
|
| bulbs (no.) | 227.635 |
| MV and LV network (km) | 8.036 |
Energy consumption for public lighting, which has been on a down- ward trend in recent years thanks to the gradual modernisation of the systems with the installation of LED technology lamps, will sta- bilise in 2021; as at 31/12/2021, the 208,870 LED lamps installed cover around 92% of the total number of lamps (see Relations with the environment; The use of materials, energy and water and the Envi- ronmental Accounts).
In 2021, the tender procedure to find a partner for the implemen- tation of the "POLEDRIC" project was concluded. It was launched the previous year, with the aim of developing an innovative techno- logical solution for the creation of a "smart pole", in a “smart city” perspective (see the chapter Institutions and the Company, Commit- ment to Research and Innovation).
The lighting projects carried out during the year include, by way of example, the new lighting of some parks and gardens located in central and suburban areas of the capital, for the benefit and greater safety of citizens, including the park at Tor Sapienza, the Commen- done park and the Villa Massimo park, and among the functional projects the installations in Via della Mortella and Via del Carbonio. (see boxes with more details).
LIGHTING WORKS IN PARKS AND GARDENS
The new lighting in Tor Sapienza Park has been financed with funds from the Quality of Light Plan 2021. The work involved the laying of more than 1.3 km of cable and the installation of 57 lighting points, with a total installed power of 2,380 W.
In Piazza Brin the objective was to standardise and brighten the lighting of the route between Via Cialdi and Via Orlando, by revis- ing the lighting of the square, the stairway and the pedestrian un- derpass; the existing lighting was integrated by installing 26 lighting points, for a total of 750W installed and 330W removed, which contributed significantly to urban decorum.
In the green area of Villa Massimo (Giuseppe de Meo garden), the existing system was upgraded and implemented by installing 21 can- delabra in the "Villa Umberto" style with "Trastevere" armature. The installed power is 790W and the removed power is 900W.
Finally, in Piazza Re di Roma, the existing system was extended by installing 10 lighting points with an installed power of 350W. The intervention contributed to the improvement of the lighting in the centre of the square, thanks to the relocation of some lighting points and to increased illumination of both the external pavements and the internal paths, achieved through the installation of new supports.
TRANQUILLO CREMONA AND ANAGNINA TUSCOLANA FUNCTIONAL INTERVENTIONS
The intervention in Via Tranquillo Cremona, in the Tor Sapienza area, concerned the realisation of a public lighting system inside an area belonging to ATER, where the existing system was modernised and integrated; 45 functional LED lighting points were installed along the road and 12 LED garden lighting points in the green area, for a total installed power of 2,800W, and about 1,000 m of cable were laid.
In the Anagnina Tuscolana area, the junction carriageway from the G.R.A. was illuminated; two 30 m high mobile crown light towers were installed at a distance of about 100 m from each other, each equipped with 12 LED projectors with asymmetrical street optics. The projectors have a power of 210W each, for a total of 5,024W installed.
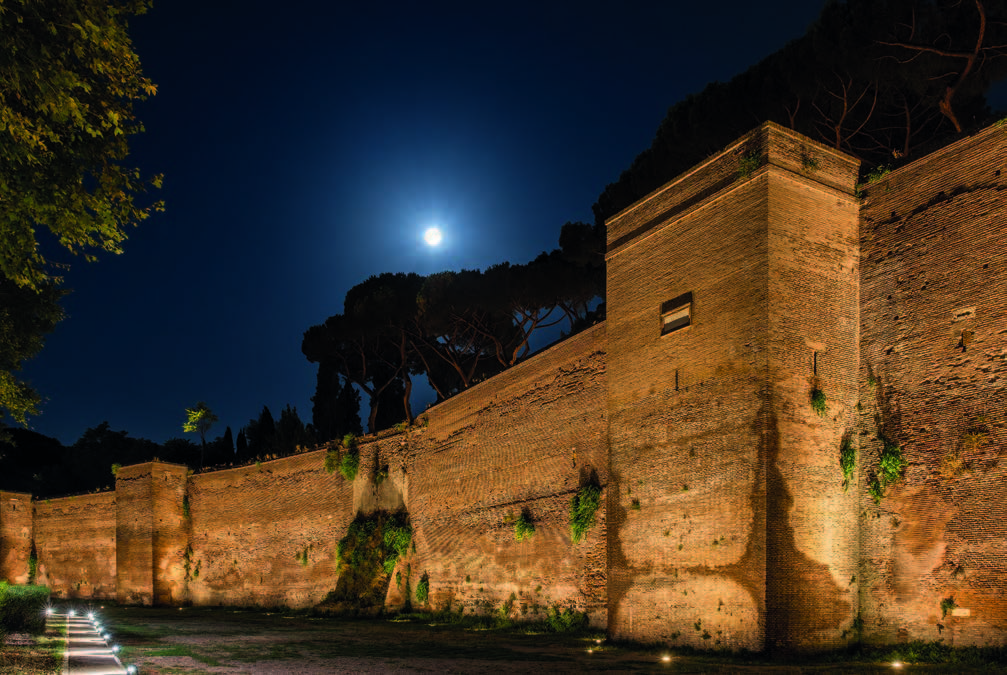
Areti has consolidated expertise in artistic and monumental light- ing, and in 2021 the main activities carried out in this area con- cerned the renovation of existing systems at sites of particular importance, including the Palatine Hill, the Aurelian Walls (in the Colombo-Numidia section), Porta S. Sebastiano and the Zodiac Fountain in Ostia, helping to enhance their beauty for the benefit of citizens and visitors (see the dedicated box below).
Every year, Areti carries out efficiency and safety upgrades at light- ing points, as well as scheduled and extraordinary maintenance on the installations (see Table 20).
Ogni anno, Areti svolge interventi di efficientamento e messa in sicurezza dei punti luce, nonché di manutenzione programmata e straordinaria sugli impianti (si veda la tabella n. 20).
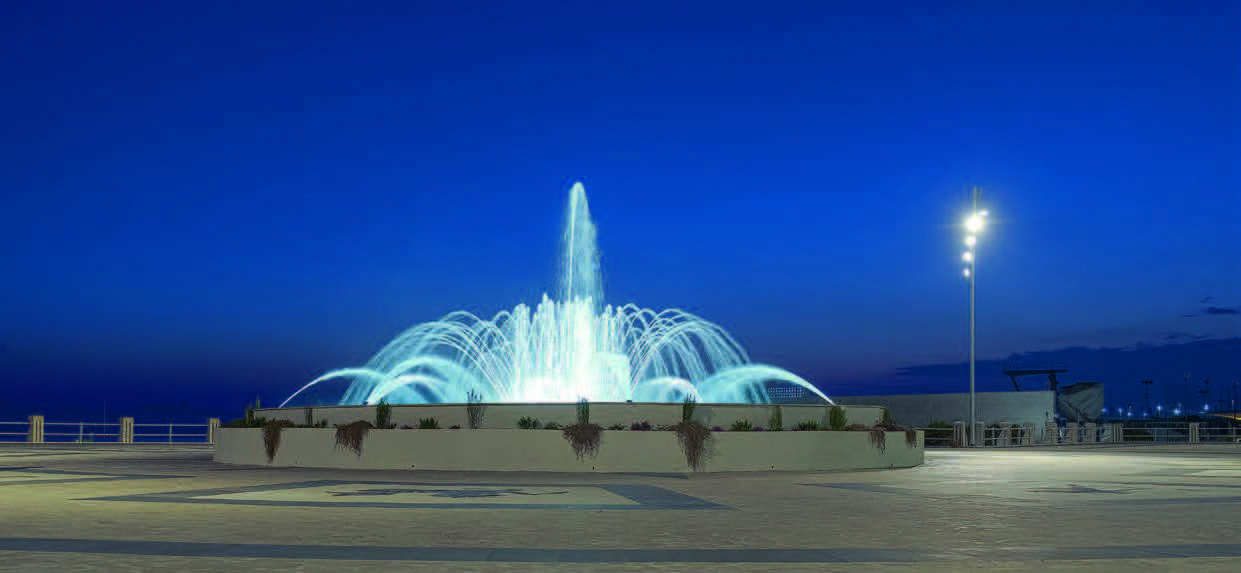
Table no. 20 – Main efficiency, safety, repair and maintenance projects (2021)
| type of work | (n.) |
|---|---|
| energy efficiency/technological innovation (replacement of fixtures) |
189 lighting points replaced (not including new LED installations) |
| safety measures | 1.817 punti luce messi in sicurezza |
| checking corrosion on lamp posts | 31.425 lighting points made safe |
| LED lamp reinforcement/maintenance | 7.952 maintenance jobs |
| Reinstalling lamp posts that were corroded or knocked down due to accidents | 1,697 lamp posts reinstalled |
NOTE: the table includes operations carried out for the Municipality of Rome and third parties.
Acea monitors the quality parameters of the public lighting service with regard to the repair time of faults, calculated from the time the report is received53. The performance standards are expressed by an average allowable restoration time (TMRA), within which re- pairs should be carried out, and a maximum time (TMAX), beyond which a penalty system is triggered54.
For the 2021 performance relating to the average recovery time (TMR) of the functionality of the systems, for the various types of failure, the best estimate available is shown in table 21, since the data, at the time of publication of this document, is in the process of being consolidated; most of the performances, with the exception of the single lighting point, are below the average permitted recov- ery time set out in the contract standards.
Table no. 21 – Public lighting recovery: Acea penalties, standards and performance (2020-2021)
| type of fault | daily penalty for delays | standard contractual service (*) | Acea service | ||||||
|---|---|---|---|---|---|---|---|---|---|
| (€) |
TMRA (average permitted recovery time)
|
TMAX (maximum recovery time) (working days) |
TMR (average recovery time) (working days) | ||||||
| 2020 | 2021 | ||||||||
| blacked out neighbourhood – MV grid failure | 70 | 1 g. | 1 g. | < 1 g. | <1 g. | ||||
| blacked out street – MV or LV grid failure | 50 | 5 gg. | 8 gg. | 1,9 gg. | 1,2 gg. | ||||
| blacked out stretch (2-4 consecutive lights out) | 50 | 10 gg. | 15 gg. | 8,4 gg. | 9,7 gg. | ||||
| Lighting points out: single lamps, posts, supports and armour | 25 | 15 gg. | 20 gg. | 8,9 gg. | 23,4 gg. | ||||
(*) Consistent with previous years, data were monitored in compliance with provisions under Annex D/2 to the 2005-2015 Municipality of Rome – Acea SpA Service Agreement.
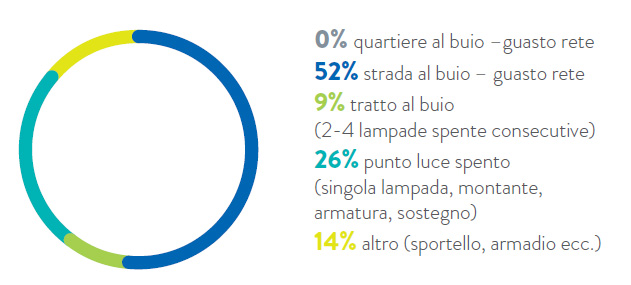
Control systems, such as remote management, detect the fault sit- uation, which can also be reported via contact channels (call centre, app, web, fax or letter)55. In 2021, 18,340 fault reports were re- ceived56 , a reduction of around 5% compared to the previous year (19,278 reports), and 91% were followed up within the year.
The percentage distribution of the total number of reports received by type of fault is shown in Chart 29. The most significant incidents confirm “blacked out street”, in relation to a "network fault" (52%) and “lighting point out” (26%), with the lowest impact in terms of safety. “Blacked out stretch” is more contained (9%) and de- creasing. During the year there have been no cases of “Blacked out neighbourhood” due to grid failure.
Chart no. 29 – Types of public lighting faults out of total reports received (2021)
As mentioned, Acea enhances the monumental heritage of the capital in agreement with the relevant authorities, with over 10,100 light fixtures for artistic lighting. The main interventions of the year, already mentioned at the beginning of the paragraph, are il- lustrated in a separate box.
AMONG THE ARTISTIC LIGHTING PROJECTS: THE PALATINE, THE ZODIAC FOUNTAIN, A NEW SECTION OF THE AURELIAN WALL AND PORTA S. SEBASTIANO
A particularly important intervention, carried out in 2021, con- cerned the Palatine Hill, where Areti carried out an extraordinary maintenance operation, replacing all the floodlights dedicated to the artistic lighting of the monumental complex with state-of-the- art fixtures, equipped with an innovative integrated system of pro- tection against power surges (SPD devices). Low-impact elements were used, custom-designed and engineered for the project, which involved the replacement of 100 old-generation lighting points and the reinstallation of 105 state-of-the-art fixtures to ensure greater weather resistance and a 15% reduction in electricity consumption. For the intervention at the Zodiac Fountain in Ostia, and in Piazzale Cristoforo Colombo, 53 20W LED underwater projectors and 18 64W LED projectors were installed; Areti was responsible for the design and implementation of the artistic lighting of the fountain and the functional lighting of the square. For the lighting of the pedestrian zone, a modular support was designed and built, the design of which was agreed with the Superintendency to minimise its aes- thetic impact. Acea sponsored the artistic lighting of the fountain. As part of the Quality of Light project, the artistic lighting of the Colombo-Numidia section of the Aurelian Walls was carried out, as a continuation of the project carried out in 2020 at the linear park of the Walls. This involved the modernisation of a discharge system and an increase in the number of existing lighting points: from 53 lighting points to 142 state-of-the-art floodlights with precision optics, with a total installed power of 9,720W. A second project was carried out at Porta S. Sebastiano, again modernising and increasing the number of lighting points by replacing 6 discharge floodlights with 36 state-of-the-art floodlights (installed power from 900W to 2,575W). The project was drawn up in collaboration with the University of Roma Tre.
The quality levels regulated by arera in the electricity sector
The Regulatory Authority for Energy, Networks and the Environ- ment (ARERA) defines, at a national level, the commercial quality standards (timing of the technical-commercial services requested by customers, such as estimates, work on connections, activation/ deactivation of the supply, response to complaints) and technical quality standards (continuity of supply) of the electricity service; it periodically reviews them, directing operators to constantly im- prove performance.
Commercial quality is divided into "specific" and "general" levels,57 for the distributor (differentiated for low and medium voltage supplies) and for those of the seller (see Tables 22, 23 and 24).
Every year Acea communicates to ARERA the results achieved and includes them in the bill it sends to its customers.
The 2021 commercial and technical quality results58 related to the distribution and metering, as disclosed herein, represent the best estimate available59 at the time of writing and may not coincide with those submitted to ARERA as part of the annual reports.
With regard to the "specific" levels of commercial quality, com- pared with last year, there has been an improvement in the timing of the execution of simple and complex works for the construction of new ordinary connections in LV (especially for domestic users) and MV, as well as a slight deterioration in other performances, although in most cases they fall within the standards set by the regulations in force.
With regard to the "general" levels, relating to responses to writ- ten complaints/enquiries, there was a deterioration in performance compared to 2020, attributable to the work of recovering back- logs, linked to the effects that the pandemic period has had on operations (e.g. the increase in complaints due to the suspension of measurement data collection by the operator) (see table 22).
Automatic compensation to customers60 to be paid in case of non-compliance with “specific” quality levels, start from a basic amount61, which can be doubled (if the timing of the activities ex- ceeds the standard between two and three times) or tripled (if the timing exceeds the standard by three times).
For the quality aspects of the sales service, managed by Acea Ener- gia, the increase in the percentages of compliance with the stand- ards set by ARERA, already recorded in the last two years (see table 23), was confirmed in 2021.
With reference to Areti's performance related to the incentive reg- ulation of the duration and number of interruptions without prior notice for low-voltage users, the data related to the 2021 financial year - summarised in Table no. 24 - indicate that in the urban areas characterised by the highest degree of concentration of users (so- called high and medium concentration territorial areas), the conti- nuity of the service was guaranteed with a noticeably better quality compared to last year. Steady and already positive results are also being achieved in suburban and rural areas.
In addition to the indicators described above, the electricity distrib- utor is also required to comply with specific levels of service conti- nuity with reference to medium voltage users for which automatic compensation will be paid62 in cases where the number of interrup- tions during the year exceeds a defined standard.
Finally, separately for medium and low voltage users in the event of failure to comply with the maximum power restoration times, there is an additional reimbursement to be paid by the distribution com- pany to each user that is disconnected for more than 4 or 8 hours respectively.
Table no. 22 – The main specific and general levels of commercial quality – energy-distribution (2020-2021)
(ARERA parameters and Areti's performance - 2020: data reported to ARERA; 2021: estimated data)
| ENERGY DISTRIBUTION | |||||
|---|---|---|---|---|---|
| SPECIFIC LEVELS OF COMMERCIAL QUALITY | |||||
| SERVICES | ARERA PARAMETERS – maximum time by which the service must be performed | average actual completion time for services | percentage of services carried out within time limit | average actual completion time for services | percentage of services carried out within time limit |
| 2020 | 2021 | ||||
| LOW VOLTAGE (LV) SUPPLIES | |||||
| DOMESTIC CUSTOMERS | ARETI’S PERFORMANCE | ||||
| estimates for work on LV networks (ordinary connections) | 15 gg. lav. | 8,09 | 95,38% | 9,08 | 91,05% |
| completion of simple work (ordinary connections) | 10 gg. lav. | 10,51 | 73,40% | 10,02 | 72,00% |
| completion of complex works | 50 gg. lav. | 13,44 | 96,15% | 11,51 | 95,13% |
| deactivation of supply on customers request | 5 gg. lav. | 1,20 | 97,38% | 1,47 | 97,46% |
| reactivation of supply following disconnection for late payment | 5 gg. lav. | 1,07 | 97,38% | 1,05 | 98,59% |
| resumption of the supply following faults of the metering | 1 g. feriale | 0,05 | 99,56% | 0,10 | 99,52% |
| resumption of the supply following faults of the metering equipment (requests sent during business days from 08:00 to 18:00) | 3 ore | 2,80 | 68,10% | 3,52 | 60,07% |
| resumption of the supply following faults of the metering equipment (requests sent during non-business days or from 18:00 to 08:00) | 4 ore | 2,52 | 87,54% | 2,40 | 86,40% |
| maximum punctuality band for appointments with customers | 2 ore | n.a. | 91,46% | n.a. | 91,70% |
| NON-DOMESTIC CUSTOMERS | ARETI’S PERFORMANCE | ||||
| estimates for work on LV networks (ordinary connections) | 15 gg. lav. | 8,21 | 95,51% | 9,98 | 88,26% |
| completion of simple work (ordinary connections) | 10 gg. lav. | 11,47 | 72,55% | 10,98 | 77,57% |
| completion of complex works | 50 gg. lav. | 16,66 | 94,59% | 17,55 | 92,49% |
| supply activation | 5 gg. lav. | 2,12 | 93,97% | 2,68 | 93,63% |
| deactivation of supply on customers request | 5 gg. lav. | 2,41 | 95,46% | 2,28 | 96,07% |
| reactivation of supply following disconnection for late payment | 1 g. feriale | 0,08 | 99,42% | 0,13 | 99,30% |
| resumption of the supply following faults of the metering equipment (requests sent during business days from 08:00 to 18:00) | 3 ore | 2,90 | 67,04% | 3,48 | 62,78% |
| resumption of the supply following faults of the metering equipment (requests sent during non-business days or from 18:00 to 08:00) | 4 ore | 2,35 | 86,45% | 2,51 | 84,91% |
| maximum punctuality band for appointments with customers | 2 ore | n.a. | 91,61% | n.a. | 91,13% |
| MEDIUM VOLTAGE SUPPLIES (MV) | |||||
| END CUSTOMERS | ARETI’S PERFORMANCE | ||||
| estimates for work on MV networks | 30 gg. lav. | 13,38 | 93,20% | 17,5 | 86,44 |
| completion of simple work | 20 gg. lav. | 17,68 | 90,91% | 3 | 100% |
| completion of complex works | 50 gg. lav. | 14,47 | 96,67% | 9,88 | 92,86% |
| supply activation | 5 gg. lav. | 5,44 | 77,78% | 10,52 | 56,53% |
| deactivation of supply on customers request | 7 gg. lav. | 12,85 | 69,70% | 19,53 | 67,86% |
| reactivation of supply following disconnection for late payment | 1 g. feriale | 1 | 82,35% | 0,42 | 100% |
| maximum punctuality band for appointments with customers | 2 ore | n.a. | 92,05% | n.a. | 92,11% |
| SPECIFIC LEVELS OF COMMERCIAL QUALITY | |||||
| SERVICES | ARERA PARAMETERS minimum percentage of services to be performed within a maximum time | average actual completion time for services | percentage of services performed within the maximum time |
average actual completion time for services | percentage of services performed within the maximum time |
| 2020 | 2021 | ||||
| LOW VOLTAGE (LV) SUPPLIES | |||||
| DOMESTIC CUSTOMERS | ARETI’S PERFORMANCE | ||||
| reply to written complaints/enquiries written for distribution activities |
95% entro 30 gg. solari | 40,05 | 60,00% | 85,47 | 50,70% |
| reply to written complaints/enquiries written for measurement activities |
95% entro 30 gg. solari | 67,68 | 53,43% | 72,46 | 44,72% |
| NON-DOMESTIC CUSTOMERS | ARETI’S PERFORMANCE | ||||
| reply to written complaints/enquiries written for distribution activities |
95% within 30 calendar days | 44,91 | 56,44% | 59,08 | 66,53% |
| reply to written complaints/enquiries written for measurement activities |
95% within 30 calendar days | 63,03 | 53,66% | 79.03 | 38,46% |
| MEDIUM VOLTAGE SUPPLIES (MV) | |||||
| END CUSTOMERS | ARETI’S PERFORMANCE | ||||
| reply to written complaints/enquiries written for distribution activities |
95% within 30 calendar days | 23,98 | 78,59% | 34,73 | 75,38% |
| reply to written complaints/enquiries written for measurement activities |
95% within 30 calendar days | 150,08 | 25,00% | 136,74 | 20,83% |
Note: the symbol “/” is used when services were not requested during the year, “n.a.” means the data are not applicable.
Table no. 23 – The main specific and general levels of commercial quality – energy sales (2020-2021)
(ARERA parameters and Acea Energia's performance - data reported to ARERA)
| ENERGY SALES | |||
|---|---|---|---|
| SPECIFIC LEVELS OF COMMERCIAL QUALITY (*) | |||
| SERVICES | ARERA PARAMETERS maximum time by which the service must be performed |
percentage of services carried out within time limit | percentage of services carried out within time limit |
| 2020 | 2021 | ||
| MORE PROTECTED SERVICE | ACEA ENERGIA PERFORMANCE | ||
| billing adjustments | 60 calendar days | 50,00% | 100% |
| double billing adjustments | 20 calendar days | / | / |
| reasoned reply to written complaints | 30 calendar days | 90,66% | 92,30% |
| FREE MARKET | ACEA ENERGIA PERFORMANCE | ||
| billing adjustments | 60 calendar days | 42,86% | 52,89% |
| double billing adjustments | 20 calendar days | / | / |
| reasoned reply to written complaints | 30 calendar days | 88,73% | 93,08% |
| GENERAL LEVELS OF COMMERCIAL QUALITY | |||
| SERVICES | ARERA PARAMETERS minimum percentage of services to be performed within a maximum time | percentage of services performed within the maximum time | percentage of services performed within the maximum time |
| MORE PROTECTED SERVICE | ACEA ENERGIA PERFORMANCE | ||
| reply to written enquiries | 95% within 30 calendar days | 99,65% | 99,72% |
| FREE MARKET | ACEA ENERGIA PERFORMANCE | ||
| reply to written enquiries | 95% within 30 calendar days | 99,33% | 99,64% |
(*) Free market and more protected service customers with low and medium voltage supplies, and end customers of low-pressure natural gas (predominantly domestic customers and small businesses) receive an automatic compensation calculated on a base value of € 25 if standards are not met.
The symbol “/” is used when services were not requested during the year, N.A. means the data are not applicable.
Table no. 24 – Service continuity data – energy distribution (2019-2021) – (ARERA parameters and Areti performance – 2019-2020: data certified by ARERA; 2021: provisional data)
| ENERGY DISTRIBUTION – CONTINUITY INDICATORS – LV CUSTOMERS | |||||
|---|---|---|---|---|---|
| DURATION OF DISRUPTIONS AND PERCENTAGE CHANGES | |||||
| SERVICES | average cumulative duration of long disruptions without prior notice under the operator’s responsibility per LV customer per year (minutes) | percentage changes | |||
| 2019 | 2020 | 2021 | 2021 vs. 2019 | 2021 vs. 2020 | |
| high concentration | 43,8 | 42,3 | 30,4 | -30,60% | -28,10% |
| medium concentration | 60,1 | 52 | 45,5 | -24,30% | -12,50% |
| low concentration | 66,4 | 47,6 | 47,3 | -28,80% | -0,60% |
| AVERAGE NO. OF DISRUPTIONS AND PERCENTAGE CHANGES (*) | |||||
| SERVICES | average no. of disruptions without prior notice under the operator’s responsibility per LV customer per year | percentage changes | |||
| high concentration | 2,016 | 1,869 | 1,603 | -20,50% | -14,20% |
| medium concentration | 2,525 | 2,589 | 2,459 | -2,60% | -5,00% |
| low concentration | 3,327 | 3,064 | 3,248 | -2,40% | 6,00% |
(*) The yearly average number of disruptions per low voltage customer considers both lasting disruptions (> 3 minutes) as well as short disruptions (≤ 3 minutes but longer than 1 second).
NOTE: the three territorial areas are defined on the basis of the degree of concentration of the resident population: more than 50,000 inhabitants is defined as “high concentration”; between 5,000 and 50,000 inhabitants is defined as “medium concentration”; less than 5,000 inhabitants is defined as “low concentration”.
QUALITY IN THE WATER AREA

The Acea Group manages the integrated water service (IWS) in several Optimal Areas of Operations (ATO) or District Areas of Lazio, Tuscany, Campania and Umbria through subsidiaries and investee companies.
Below, in line with the scope of reporting (see Communicating sus- tainability: methodological note), we describe the activities carried out in Lazio, Campania and Tuscany by the following companies:
- Acea Ato 2, Acea Ato 2, in ATO 2 - Central Lazio (Rome and 112 other municipalities63, of which 80 are managed 64 by Acea Ato 2, equal to about 94% of the population in the area), the Group's "historical" area of operation65, with a pool of residents served of over 3.7 million;
- Acea Ato 5, in OTA 5 – southern Lazio – Frosinone (86 municipal- ities managed66in the area of Frosinone and vicinity, equal to about 95% of the population), for about 455,000 residents served;
- GORI operates in the Sarnese-Vesuviano district (in 76 municipalities - 59 in the province of Naples and 17 in the province of Salerno - of which 74 are managed), with approximately 1.4 million residents served;
- Gesesa operates in the ATO - Calore Irpino (22 municipalities managed, in the area of Benevento and province), with more than 110,000 residents served.
- AdF - in the reporting perimeter from this year - operating in the ATO 6 Ombrone that includes 55 municipalities (28 in the province of Grosseto and 27 in the province of Siena) with a population of more than 380,000.
The integrated water service (IWS) involves the entire cycle of drink- ing water and wastewater, from the collection of water from the springs until its return to the environment, and is regulated by a man- agement agreement signed between the Company that takes charge of the service and the Area Authority (AGB – Area Governing Body). The Regulatory Authority for Energy, Networks and the Environ- ment (ARERA), which also regulates the water sector at a national level, has defined the minimum essential contents of the "Standard Agreement" between the entrusting bodies and the service opera- tors. For the main regulatory interventions in the water sector un- dertaken during the year by ARERA, see paragraph Context analysis and business model (Group Profile chapter), and for more details see the Authority’s website.
The Integrated Water Service Charter, annexed to the Agreement, defines the general and specific quality standards that the oper- ator must respect in relation to the users, in compliance with the ARERA Resolutions on contractual quality and technical quality aspects. The User Regulations, also annexed to the Agreement, govern the relationship with customers, establishing the techni- cal, contractual and economic conditions that are binding for the operator in the provision of services. For the contractual quality performance of water companies, see below the sub-section Levels of quality regulated by ARERA in the water segment.
The management activities of the integrated water service, though closely related and therefore allowing an optimal definition of the processes, must relate to situations that are very diversified from the standpoints of sale, demographics, geomorphology and hydrology of the regions served, which also have an impact on the infrastructure to be implemented. The Companies operate in compliance with the procedures of the certified management systems, in particular, for Acea Ato 2, Acea Ato 5 and Gesesa in the areas of Quality, Envi- ronment, Safety and Energy, for GORI in the areas of Quality, En- vironment and Safety and for AdF in the areas of Quality and Safety (see, for further details, The corporate identity, The management systems).
Consistency, interventions and remote control
The companies managing the IIS are engaged in progressive digit- ising of the networks, through studies, field surveys and data entry into the geo-referenced information system (GIS). In particular, at 31/12/2021, Acea Ato 2 has over 85% of the networks traced in the GIS system; Acea Ato 5 has digitised about 4,917 km of the water network at 31/12/2021 and in 2021 completed the surveys on an- other 925 km (24 municipalities). GORI and Gesesa have geo-ref- erenced the stocks shown in Table 25 and are continuing to survey and update the data; Gesesa has already geo-referenced the water sites (wells, springs, reservoirs/partitions) and the sewage lifting and treatment plants, including their functional diagrams.
Table no. 25 – Water mains areas 2021 (geo-referenced data)
| company | drinking water network (km) | sewerage network (km) |
|---|---|---|
| Acea Ato 2 | 13,152 (723.4 km of aqueduct, 1,127 km of supply network and 11,301 km of distribution) | 6.217 |
| Acea Ato 5 | 6,027 (1,207 km of supply network and 4,820 km of distribution network) | 1.776 |
| Gori | 5,215 (865 km of supply network and 4,350 km of distribution network) | 2.625 |
| Gesesa | 2,063 (174 km of supply network and 1,889 km of distribution network) | 523 (among outfalls, main and secondary collectors) |
| AdF | 8,328 (1,993 km of supply network and 6,335 km of distribution network) | 1,746 (among outfalls, main and secondary collectors) |
The networks are connected to a complex system of equipment and plants necessary for the operations of the aqueduct, treatment and sewerage services. Each year, the Companies carry out:
- infrastructure interventions such as modernisation or strength- ening of the plants the remote control of infrastructures, the completion, extension or the drainage of pipelines and net- works, to contain the losses and improve the efficiency and quality of the service provided;
- interventions to improve utility management (such as installa- tion and replacement of meters), in addition to everything con- cerning the relationship with customers, for which reference is made to the paragraph Customer care);
- interventions to protect people and territory, aimed at ensuring the quality of the drinking water distributed and the water re- turned to the environment (such as Water Safety Plans - WSPs- and laboratory controls; see also the section Relations with the environment and the chapter Institutions and the Company).
For a quantification of the main interventions carried out by the com- panies during the year and the analytical checks on drinking water and waste water carried out independently or by Acea Elabori, see Table 26. Acea Ato 2 pursues security and greater resilience of the supply system managed, in compliance with the Concession flows. In par- ticular, under Ministerial Decree No. 517 of 16 December 2021 "In- vestments in primary water infrastructures for the security of water supply", Acea Ato 2 obtained funding of € 150 million as the imple- menter of four strategic interventions67 within the broader project of making Rome's water supply safe and modernising it; see also the box - Interventions on strategic infrastructures, Peschiera - Le Capore and Marcio aqueducts: making them safe and authorisation procedures - paragraph Protection of the territory and safeguarding biodiver- sity in Relations with the environment. The design of strategic infra- structures is also defined, in collaboration with Acea Elabori, with specific attention to sustainability criteria (see box with details).
STRATEGIC INFRASTRUCTURES OF ACEA ATO 2: ENVISION AND CAM FORESEEN IN THE DESIGN
On the new upper section of the Peschiera Aqueduct, design ac- tivities continued in order to obtain environmental authorisations and Envision Certification - the first rating system for building sustainable infrastructures; a methodological approach was defined and applied to estimate the CO2 emissions generated by the infra- structure construction activities. For the Marcio aqueduct, a Sus- tainability Report was prepared in compliance with EU Regulation 852/2020 on the European taxonomy, in order to verify compli- ance with the principle of "not causing significant damage", and with the reference regulations of the NRRP. In addition, the document containing the prospective indications for sustainable engineering and for the application of the Minimum Environmental Criteria (CAM) for both infrastructures is being further developed.
In 2021, Acea Ato 2 installed 144 hydro valves to optimise the op- erating pressures of the distribution networks and reclaimed 203.4 km of water mains; it started work on major supply systems to increase the resilience of complex municipal systems; to increase the availability of water in the municipalities of Castelli Romani, it completed the new drinking water plants serving the Madonna di Coccio and Camporesi wells in the municipalities of Castel Gandol- fo and Ciampino. The programme to install flow-limiting devices on rural utilities has also continued to limit non-drinking consumption.
Table no. 26 – Main interventions on the drinking water and sewerage networks and controls on drinking water and wastewater (2021)
| INTERVENTIONS ON DRINKING WATER NETWORKS, METERS AND WATER TESTS | |
|---|---|
| type of work | |
| ACEA ATO 2 | |
| interventions due to network failure/leak detection | 35.313 interventions (34,904 due to faults, 409 leak detection) |
| meter installations (new installations and replacements) | 15.807 interventions (12,233 new installations and 3,574 replacements) and 135,448 massive replacements with contract |
| network extension | 203,39 km of expanded network |
| network reclamation | 10,10 km of reclaimed network |
| drinking water quality control | 11,926 samples collected and 346,164 tests performed |
| ACEA ATO 5 | |
| interventions due to fault | 11.046 interventi of repair |
| planned interventions | 1 intervention (on supply network) |
| meter installations (new installations and replacements) | 30.103 interventions (3,082 new installations and 27,021 replacements) |
| network extension | 0 km of expanded network |
| network reclamation | 31,7 km of reclaimed network |
| drinking water quality control | 2,530 samples collected and 105,430 tests performed |
| GORI | |
| interventions due to network failure/leak detection | 15.604 interventions (13,767 due to faults, 1,837 leak detection orders) |
| planned interventions | 7.065 interventions |
| meter installations (new installations and replacements) | 26.194 interventions (12.937 nuove pose e 13.257 sostituzioni) |
| network extension | 0,23 of expanded network |
| network reclamation | 14,07 km of reclaimed network |
| drinking water quality control | 4.903 samples collected and 136,156 tests performed |
| GESESA | |
| interventions due to network failure/leak detection | 4,340 interventions (4,104 due to faults, 236 leak detection) |
| planned interventions | 56 interventions |
| meter installations (new installations and replacements) | 3.190 interventions (1,113 new installations and 2,077 replacements) |
| network extension | 3 km of expanded network |
| network reclamation | 1,4 km of reclaimed network |
| drinking water quality control | 828 samples collected and 11,955 tests performed |
| AdF | |
| interventions due to network failure/leak detection | 8.836 interventions (8,200 due to faults, 636 leak detection) |
| planned interventions | 71 interventions |
| meter installations (new installations and replacements) | 38.686 interventions (3,518 new installations and 35,168 replacements) |
| network extension | 1,8 km of expanded network |
| network reclamation | 48 km of reclaimed network |
| drinking water quality control | 4,757 samples collected and 139,634 tests performed |
| INTERVENTIONS ON SEWERAGE NETWORKS AND TESTS | |
| type of work | |
| ACEA ATO 2 | |
| interventions due to network failure | 3.302 interventions |
| planned interventions | 172 interventions |
| network extension | 8,23 km of expanded network |
| network reclamation | 17,6 km of reclaimed network |
| wastewater quality control | 6,646 samples collected and 127,417 tests performed |
| ACEA ATO 5 | |
| interventions due to network failure | 655 interventions |
| planned interventions | 1 intervention |
| network extension | 0 km of expanded network |
| network reclamation | 1,6 km of reclaimed network |
| wastewater quality control | 3,044 samples collected and 40,636 tests performed |
| GORI | |
| interventions due to network failure | 545 interventions |
| planned interventions | 6.576 interventions |
| network extension | 1,11 km of expanded network |
| network reclamation | 4,25 km of reclaimed network |
| wastewater quality control | 1.584 campioni prelevati e 43.270 determinazioni analitiche performed |
| GESESA | |
| interventions due to network failure | 203 interventions |
| planned interventions | 7 interventions |
| network extension | 0 km of expanded network |
| network reclamation | 0,05 km of reclaimed network |
| wastewater quality control | 489 samples collected and 11,448 tests performed |
| AdF | |
| interventions due to network failure | 373 interventions |
| planned interventions | 41 interventions |
| network extension | 0 km of expanded network |
| network reclamation | 2,6 km of reclaimed network |
| wastewater quality control | 7,372 samples collected and 51,707 tests performed |
Acea Ato 2's aqueducts and supply network are equipped with re- mote-control systems: meters and sensors connected to the field equipment provide the central system with useful information on the condition of the network and its operation (system set-up, pump and valve status, hydraulic, chemical, physical and energy measurements), highlighting any alarms and offering the possibil- ity of remote operation, such as turning pumps on or off, opening, closing or adjusting valves. Rome's particularly complex distribution network is fed by water centres, where remote control has been implemented extensively. The number of water centres and points on the network that have been partially or fully remote-controlled has further increased: at the end of 2021, there were 1,019 re- mote-controlled plants on the collection and distribution network (springs, wells, aqueducts, supply systems, water centres, drinking water treatment plants) and a further 1,662 remote-controlled ones along the distribution network (1,066 districtisation points, 106 water kiosks and 490 network pressure measuring points, in- cluding 319 hydro valves and 171 pressure points). Of these, 355 are equipped with water quality measurement systems. For the sewage system the progressive remote control of the entire sec- tor is very advanced which intervenes on both central systems and plants (large and small treatment plants and sewage lifting plants): the main treatment plants are already remotely controlled through on-site rooms and further work to upgrade the technology and connect them to the central room is in progress.
The water sites managed by Acea Ato 5 - including supply sources, distribution plants, sewage lifting stations and purification plants - are partly equipped with remote control, which makes telemetry, remote command and control possible, as well as the detection of hydraulic (water flow rate, network pressure, tank level, oper- ating status of electric pumps), electrical and qualitative (turbidity and residual chlorine) parameters. At the end of 2021, there were 331 plants with a remote-control system installed (equipped with hydraulic measurements - flow rates, pressure and levels -, 16 of which were also equipped with water quality control) and 111 net- work points (with continuous pressure or flow monitoring systems). The plants managed by GORI, relating to the drinking water, sew- age and purification systems, are all equipped with remote-control systems; as at 31/12/2021, there were a total of 677 plants, of which 269 water sites and 203 water network nodes, 195 sewage sites and 10 purification sites, at which the same activities as indicated above for Acea Ato 5 are carried out. At GORI's plants, a local control system provides automated management (with human interven- tion only in emergencies) of electric pumps and valves according to a logic of energy efficiency and saving of water resources; in the largest reservoirs, outflow control valves are installed and remote- ly controlled, for dynamic adjustment of the quantity of resource supplied based on different water availability scenarios; finally, the progressive application of IoT technologies in nodes of the water and sewerage networks where electricity is absent allows essential network parameters (pressures and flows) to be monitored.
Gesesa has continued the programme of installing the remote-con- trol system at the water sites it manages; in particular, in 2021 it completed the implementation of remote control on 4 sewage lifting stations and started the installation of an alarm system on all the purification plants. It has also been awarded the works for upgrading and securing several of the water plants it manages. AdF has also continued the progressive implementation of remote control on its plants, extending it to 45 more aqueduct sites in 2021. Constant monitoring of the networks (district flow measurements and con- trol valves) and of the smaller reservoirs makes it possible to reduce inefficiencies; the automatic instruments installed on the pumping systems of the sewage lifts also facilitate predictive maintenance, frequency analysis of alarms, and the status of priority process meters for management and budgetary purposes. Work continued during the year on the implementation of automatic regulation of the network, depending on pressure conditions, and testing of bat- tery-powered pressure and flow rate sensors with NB-IoT technol- ogy, and their management and analysis platform.
The issue of limiting losses on distribution networks is carefully monitored by all Group companies, which are committed to the sustainable management of the water cycle; to this end, organisa- tional structures dedicated to protecting the resource have been set up. The companies carry out districtisation, inspection and rec- lamation of the networks, installation of automatic valves and other pressure control instruments, as well as verification and calibration of meters, identification of abnormal consumption and also initia- tives to combat illicit connections and improper use of the resource. The specific activities undertaken in 2021 by each company are il- lustrated in the dedicated chapter Water Segment in the section Relations with the environment, to which reference should be made.
Utility management and service continuity
The companies continued in 2021 with the installation of new meters and the replacement of old ones (see figures in Table 26). As part of its mass meter replacement activities, Acea Ato 2 has continued its experience in the field of IoT, "Water meter remote reading development", in collaboration with Areti, which has led to the development and testing of a patented product called "Proteus". During the year, a total of about 17,000 Proteus NB-IoTs were in- stalled and put into operation on as many water users and public fountains in Rome. In 2021, around 1,100 meters were brought into remote reading mode, bringing the total number of installed remote reading meters to over 30,000 as of 31/12/2021.
In addition, Acea Ato 2 focused during the year on a diversified remote meter-reading strategy, which includes the introduction of specific solutions according to different installation require- ments. In fact, in addition to Proteus NBIoT devices, the company has started both the procurement of integrated market meters – devices with ultrasound technology that allow for taking measure- ments and remote reading – and the design and development of a new advanced smart metering system for the water service, from which benefits are expected in terms of, for example, optimisation of data quality and quantity, maximisation of the use of communi- cation technologies, and cybersecurity.
AdF continued to massively implement remote reading of meters in the area, through drive-by and walk-by reading, installing over 38,000 meters in 2021 and achieving coverage of 50% of the en- tire fleet of meters; the work carried out in Grosseto, Follonica and Orbetello made it possible, in fact, to almost complete the largest municipalities managed. The solution installed makes it possible to increase the frequency of readings and facilitate data collection. AdF has also created a platform for analysing, checking and moni- toring data from remote reading which, by also integrating data col- lected by fixed and mobile concentrators, will allow greater control of the flows supplied and network balance.
The continuity of the water supply is one of the fundamental ser- vice parameters for customer satisfaction, which has been subject to regulation by the ARERA. Table no. 27 shows the data of the last three years relating to disruptions and water reductions, urgent (due to accidental breakdowns of pipelines or plants, energy inter- ruption, etc.) or planned, for the Companies in question.
Table no. 27 – Number, type and duration of disruptions in the supply of water (2019-2021)
| type of disruption | 2019 | 2020 | 2021 |
|---|---|---|---|
| ACEA ATO 2 (*) | |||
| urgent disruptions (no.) | 1.304 | 1.207 | 881 |
| planned disruptions (no.) | 204 | 212 | 341 |
| total disruptions (no.) (**) | 1.508 | 1.419 | 1.222 |
| suspensions lasting > 24hrs (no.) | 170 | 196 | 147 |
| ACEA ATO 5 | |||
| urgent disruptions (no.) | 428 | 521 | 691 |
| planned disruptions (no.) | 338 | 568 | 397 |
| total disruptions (no.) (**) | 766 | 1.089 | 1.088 |
| suspensions lasting > 24hrs (no.) | 0 | 0 | 0 |
| GORI (*) | |||
| urgent disruptions (no.) | 1.755 | 3.042 | 2.629 |
| planned disruptions (no.) | 218 | 103 | 59 |
| total disruptions (no.) (**) | 1.973 | 3.145 | 2.688 |
| suspensions lasting > 24hrs (no.) | 0 | 0 | 0 |
| GESESA (*) | |||
| urgent disruptions (no.) | 107 | 90 | 17 |
| planned disruptions (no.) | 31 | 57 | 19 |
| total disruptions (no.) (**) | 138 | 147 | 36 |
| suspensions lasting > 24hrs (no.) | 3 | 1 | 8 |
| AdF (*) | |||
| urgent disruptions (no.) | 1.978 | 2.378 | 2.155 |
| planned disruptions (no.) | 179 | 390 | 468 |
| total disruptions (no.) (**) | 2.157 | 2.767 | 2.623 |
| suspensions lasting > 24hrs (no.) | 175 | 48 | 64 |
(*) The 2020 figures for Acea Ato 5, AdF and GORI have been consolidated. The 2021 figures for Acea Ato 2, GORI, Gesesa and AdF and Gesesa are still being consolidated. Any adjustments, after data consolidation, will be reported in the next reporting cycle.
(**) As envisaged by the Authority, total disruptions include both shutdowns (due to damage to pipes/pipelines and network changes) and interruptions due to disruptions and system anomalies. The number of total out of service cases is therefore used for the calculation.
Water distributed and returned to the environment
The quality of the drinking water distributed mainly safeguards aspects related to health and safety of the community and is therefore an essential element of the service. The same approach also applies, however, to the water returned to the receiving wa- ter bodies, as regards safeguarding ecosystems. Consequently, all the Companies independently carry out controls on drinking and wastewater using internal laboratories or with the support of the Acea Elabori Group Company (see Table no. 26).
In particular, tests on water intended for consumption are carried out on samples collected from springs and wells, supply plants, res- ervoirs and along distribution networks, as well as samples collect- ed for extraordinary testing (users, local health authority requests, etc.) and specific parameters (e.g. radioactivity). Test frequency and sampling points are defined taking into consideration the volumes of water distributed, population served, network and infrastruc- ture conditions and specific characteristics of local springs (see also Environmental relations).
All the Water Operations Companies in the group have started preparations or begun to implement Water Safety Plans (WSP), aimed at preventing and reducing the risks inherent to the drink- ing water service; the activities in question, conducted in 2021, are illustrated in the dedicated (Water Safety Plans - WSP) section of the Water Segment chapter in the Environmental relations section, to which reference should be made.
As regards the territory managed by Acea Ato 2, the spring water collected to supply the Rome and Fiumicino area presents levels of excellent quality at the source, while in the Castelli Romani area and other areas of upper Lazio, the volcanic nature of the terrain adds mineral elements to the aquifer such as fluorine, arsenic and vanadium, in concentrations exceeding those envisaged by the law. For some time, Acea Ato 2 has been working to resolve these is- sues, such as by decommissioning some local sources of supply and replacing them with higher quality springs. In 2021, in particular, Acea Ato 2 built new drinking water plants and upgraded/expand- ed existing plants in the municipalities of Marino, Castel Gandolfo, Ariccia, Rignano Flaminio, Civitavecchia and Pomezia. It has also started work on aqueduct interconnections that will ensure greater network resilience and improve the service provided.
In 2021, AdF implemented the first phase of the project planned
in 2020 to monitor the quality of supply sources with online in- strumentation. The installation of the instruments, the acquisition of the remote-control signals and the preparation of the relative control/reporting dashboards were carried out, through which it is possible to integrate the qualitative data collected with quantita- tive information and with the meteorological and hydrogeological information made available online by the related regional services, updated on a daily basis. During the year, the first 8 supply sources were monitored, which together provide approximately 68% of the water resource distributed by AdF; these include the Santa Fiora springs, and advanced monitoring of the arsenic parameter, using a high-tech analyser tested in 2020, in the water of the Galleria Alta spring is planned. The project envisages monitoring around 75% of the resources drawn from the environment, leaving out only small and very small sources, whose suitability for online monitoring can be assessed on a case-by-case basis.
The installation of online measurement systems and the uptake of remote control makes it possible to continuously monitor the quali- ty of the water and activate early warning systems as provided for in the new quality guidelines for the safety of drinking water specified by the recent European Directive 2020/2184.
GORI supplies its users with quality water, collected from deep wells. The qualitative characteristics of the water distributed are ver- ified by the internal "Francesco Scognamiglio" laboratory, located in Pomigliano d'Arco, which uses cutting-edge instruments, including a spectrometer capable of determining all the metals indicated by the regulations in force on drinking water. The introduction of this equipment has made it possible to reduce the time required to carry out analyses and to reduce laboratory consumables, reagents, the quantity of technical gas and electricity consumption.
Gesesa participates in the technical round table, together with the Campania Water Authority, local, provincial and regional institu- tions, and Arpac and the local health authorities, dedicated to the monitoring and characterisation of the groundwater resource that, through the Campo Mazzoni and Pezzapiana wells, supplies the city of Benevento. In the previous two years it carried out an extraor- dinary control plan for the tetrachloroethylene parameter in the groundwater, finding concentrations below the values imposed by the reference legislation. In 2021, Gesesa launched a project aimed at creating an activated carbon filtration system for the treatment of drinking water at the Benevento water plant (see the dedicated box in Relations with the environment, Water area, paragraph Wa- ter quality).
In 2021, there were 131 water kiosks active (106 of Acea Ato 2, of which 31 in the City of Rome and 75 in the province of Rome, 20 of GORI and 5 of AdF, which has another 2 in the start-up phase); these are dispensers of chilled natural or sparkling water, installed throughout the territory, available to citizens and tourists, free of charge or at minimal cost. The water distributed is the same as the aqueducts and the quality is certified by regular checks conducted by the companies and the relevant local health authorities. The initiative met with a positive response and in 2021, the "kiosks" supplied a total of over 30 million litres of water (about 26.8 million litres from Acea Ato 2, about 3.2 million litres from GORI and about 35,000 litres from AdF water kiosks), with a percentage of sparkling water of about 56%. The environmental benefits are clear: the litres dispensed are equivalent to 601 tonnes of plastic saved over the year (equal to over 20 million 1.5 litre bottles) and over 1,580 tonnes of CO2 not emit- ted into the atmosphere (around 63% more than the 2020 figure of 968 tonnes of CO2 avoided), due to the lack of bottle production68 and net of emissions due to the energy consumption of the kiosks69 and the CO2 added to obtain sparkling water.
Acea Ato 2, by virtue of the new installation plan approved by the OTS, will be able to install a further 100 water kiosks; the company has also undertaken a project for the installation and maintenance of water kiosks and dispensers on behalf of third parties, which in 2021 allowed it to install two water kiosks and one dispenser at LUISS University, one at the Quirinale and one at the Ministry of Economy and Finance.
Acea Ato 2 is also responsible for water up to the "point of supply" for the drinking water fountains in the territory of Rome. . Launched by Acea in 2020, the Waidy app makes it possible to identify the water supply points located throughout the territory. In 2021 it was renamed Waidy Wow and underwent evolution aimed at improving the user experience, becoming a complete tool with better perfor- mance. The graphical interface has been improved and the number of water points mapped across the country has increased to over 50,000; a feature has been made available that allows the user to add a new water point directly. Artistic, cultural and historical content has been expanded to enhance the area, and news and in-depth ar- ticles on sustainability have been added in order to involve users and create a community attentive to environmental and social issues. A feature allows users to identify personalised routes by following the "waterways" (drinking fountains, artistic fountains, water kiosks) or to access pre-set thematic routes and related multimedia content. Finally, the app gives access to a "Web radio", a channel dedicated to infotainment with 24-hour music programming and the inclusion of "short videos on sustainability" in collaboration with LifeGate.
THE PERCEIVED QUALITY OF DRINKING WATER, RESULTS OF THE 2021 SATISFACTION SURVEYS
Acea measures customer habits and perceptions regarding the quality of the drinking water supplied. The customer satisfaction surveys, carried out twice a year, include not only an overall opinion on water quality but also an in-depth analysis of the subject. The outcomes presented below are the average of the two surveys.
For Rome and Fiumicino, where the service is managed by Acea Ato 2, the overall opinion on taste, smell and clarity of drinking water expressed by the sample of respondents remains stable and high at 7.6/10 (it was 7.7/10 in 2020); 39.2% of those interviewed, a figure that is down compared to 2020 (46%), state that they ha- bitually drink the water that comes to their homes, while 28%, the same percentage as in 2020, state that they never drink it; among the reasons given by those who never drink water at home, 49.4% continue to be the habit of drinking mineral water, while 27.2% re- sponded that it is "not good for my health".
The surveys carried out in 2021 in the other areas of Lazio where Acea Ato 2 operates used a larger sample of respondents than in 2020, representing different and larger areas, so the results are not directly comparable. The surveys showed that the overall satisfac- tion rating for water quality in the province is 6.8/10; 25.1% say they drink tap water regularly and 45.9% never drink it; for 38.6% of the latter, the reason is related to their habit of drinking mineral water, while 25% say "it's not good for my health".
For Acea Ato 5 customers in Frosinone and vicinity, in 2021 the overall opinion expressed on drinking water came to 6.1/10 (it was 6/10 in 2020). The percentage of respondents stating that they habitually drink tap water remains limited and is decreasing at 17% (it was 21% in 2020), while the percentage of those stating that they never drink it, equal to 54.9% is high, although decreasing with respect to 2020 (59%). For the latter, the main reasons given were the habit of drinking mineral water for 34.3% and "not good for my health" for 34.1%.
In the Sarnese Vesuviano district, the overall opinion on drinking water expressed by GORI's customers in 2021 remains stable at 6.2/10 (6.1/10 in 2020), as do the percentages of respondents who say they habitually drink tap water, 23% (same figure as in 2020) and never drink it, 52.4% (slightly down from 53% in 2020). The main reasons cited by those who do not prefer tap water are 'it’s not good for my health', for 30.2%, and 'I don't like the taste', for 24.1%. For customers of Gesesa, in Benevento and province, the overall opinion expressed on the quality of drinking water is 6.9/10 (6.6/10 in 2020); continuing its upward trend, although only slightly, is the percentage of customers who say they drink tap water regularly, which was 16.6% in 2021 (against 13% in 2020) with a slight de- crease in the percentage of those who state that they never drink it, which came to 55.6% (against 56% in 2020); in this area also, the prevailing reasons given were “it is not good for my health”, 39.5% of the respondents and “I am accustomed to drinking mineral water”, 36.9% of respondents.
For customers of AdF, operating in the province of Grosseto and Siena, the overall opinion expressed on drinking water remains sta- ble and was 6.9/10 (compared with 7/10 in 2020). The percentage of respondents who say they habitually drink tap water, 36.9%, has increased slightly (35% in 2020) and the percentage who say they never drink it (45% in 2020) has decreased more significantly to 40.2%, because "I don't like the taste" in 33% of cases, and because they are used to drinking mineral water in 29.8%.
The collection of wastewater and its treatment prior to being re- turned to the environment takes place through a complex system and a configuration organised by “areas” comprising wastewater treatment plants, sewerage networks connected thereto and the associated pumping stations. Acea Ato 2 manages 676 sewage lifting plants, 166 purification plants and more than 7,000 km of sewerage networks (of which 6,217 km mapped on GIS); in 2021, the company continued with its plan to centralise the purification plants, for the work carried out, see the box in the Water Area chapter of the section Relations with the environment.
The Acea Ato 2 Environmental Operations Centre constantly monitors data recorded remotely using cutting-edge technology relating to hydrometric and rainfall information for the Rome area, shared with the Rome Hydrographic and Tide Gauge Operations Office, as well as data on the quality of water of the water bodies: In 2021, 366 samples were taken at 32 sampling points on the Tiber and Aniene rivers and on Lake Bracciano.
In the territory of the municipality of Rome, Acea Ato 2 also manages the lifting plants and tanks for the watering network and the non-drinking water network supplying the water features of the most important artistic fountains. In particular 9 of the main ar- tistic and monumental fountains of the capital: the Triton Foun- tain, the three fountains in Piazza Navona – the Fountain of the Four Rivers, the Moor Fountain and the Fountain of Neptune – the Trevi Fountain, the Fountain of Turtles, the Fountain of Moses, the Fountain of the Naiads.
The infrastructure of the water treatment and sewerage service managed by Acea Ato 5 includes, as at 31/12/2021, 229 sewage lift- ing plants, 127 purification plants and approximately 1,776 km of dedicated networks. GORI manages 2,625 km of network serving the water treatment and sewage system and 10 purification plants some serving individual municipalities and others serving inter-mu- nicipal areas of Sarnese-Vesuvius agriculture. In 2021, GORI un- dertook a major project to complete the sewerage and purification works in the Sarno hydrographical basin (see the dedicated box).
GORI LAUNCHES THE ENERGIES FOR THE SARNO PROJECT
The Campania Region, through the Ente Idrico Campano (Cam- pania Water Authority), has identified GORI as the implementing party for the completion of the sewage and water purification works in the Sarno hydrographical basin in the Sarnese Vesuviano district in 2020.
The Energies for the Sarno project, which began in 2021, will have a significant environmental impact through the gradual completion of the sewage network and the consequent collection for purifi- cation, creating the conditions – with the elimination of polluting discharges – to reestablish the river ecosystem with consequent positive effects on the entire area and the Gulf of Naples, as well as on the health of agricultural products and the health of citizens, around 800,000 people living in the 33 municipalities of the basin, plus those living in neighbouring municipalities. GORI has under- taken the project with a remarkable involvement of local stakeholders, in addition to the 33 municipalities involved in the project, also the canning industry and the environmental association Mare- vivo Non-Profit Organisation, with the aim of setting up partici- patory dialogues and synergistic collaborations. Four permanent round tables have been set up on different levels of action: planning and carrying out works, combating illegal discharges, preventing flooding and shared communication. Participatory involvement was also extended to customers with the first phase of the "A click for the Sarno" campaign, through which GORI set aside € 1 for each subscription to the "web bill" service to implement initiatives aimed at rehabilitating the river. More than 19,000 users signed up during 2021. The corresponding amount will be allocated to projects to be implemented, identified with Marevivo and shared with the mayors, which will be voted for by the users who participated in the cam- paign, in a contest launched by GORI.
As at 31/12/2021 the infrastructure of the water treatment and sewerage service managed by AdF included 291 sewerage lifting plants, 149 purification plants (and 153 Imhoff tanks) and over 1,746 km of sewage networks. In the ATO in which Gesesa oper- ates, the infrastructure managed by the company includes 19 sew- erage lifting plants, 30 treatment plants and 523 km of dedicated networks. For the city of Benevento, the Municipality of Benevento is still planning the design of a centralised treatment plant, including connection outfalls.
Quality levels regulated by Arera in the water sector
The Regulatory Authority for Energy Networks and Environment (ARERA) defines the specific and general levels of contractual quality for the water sector70. With resolution 547/19, the Author- ity amended and supplemented the previous regulations outlining an incentive system divided into bonuses and penalties to be attrib- uted from 2022 based on operators’ performance. In view of the distribution of the incentives, in addition to calling for controls on operators on this issue, at the end of 2021 the Authority issued for consultation the update to the methods used to verify contractual quality information for the integrated water service with regards to control procedures and penalty amounts. Additionally, with reso- lution 639/2021 of 30 December, the Authority established cer- tain flexible elements in the mechanisms used to assess contractual quality performance, including cumulative evaluation of quality objectives on a two-year basis (2022-2023).
Coinciding with the introduction of the new contractual quality incentive system, the water tariff method for the third regulatory period (2020-2023), regulated by Resolution 580/2019/R/Idr, did not maintain the possibility, already provided for the previous regulatory four-year period71, of accessing premiums relating to contractual quality in the event of the achievement of improved quality standards with respect to those defined at the national level by Resolution 655/2015/R/Idr. Acea Ato 2 has in any case main- tained the improved levels of contractual quality standards, as de- fined by the application submitted in 2016 by the Area Governing Body (Conference of Mayors of ATO 2 Central Lazio) and accept- ed by ARERA, and by the amendments subsequently made by res- olution 4/20 of the Conference of Mayors relating to the updating of the Service Charter. In particular, the improvement standards concern 39 indicators out of the 47 established by the resolution. For some services envisaged in the Service Charters attached to their respective concession agreements, Acea Ato 5 and AdF also pursue and have maintained standards that are better than those imposed by the Authority.
The timing of the delivery of data on specific and general contrac- tual quality levels to the Authority shall be subsequent to the pub- lication of this document. Therefore, unconsolidated data for all companies are presented here, based on the best estimates available at the time of publication, and are intended as indicative of performance trends; consolidated data will be published in the next reporting cycle (see Tables 28-32).
There is a mechanism for automatic compensation of customers in the event of non-standard performance on "specific" indicators, the value of which varies according to the delay in performance (see also the box describing investigations, rewards and penalties in the chapter Institutions and the Company).
The water companies, as required by the Authority, communicate commercial performance data to users in their bills once a year,A- cea Ato 2, Acea Ato 5 and AdF also publish them online, and all publish information on the quality of the drinking water distribut- ed on their websites.
Table no. 28 – The main specific and general levels of contractual quality in the water segment (2020-2021) – Acea Ato 2 (ARERA parameters, improvement standards and Acea Ato 2 performance - 2020 figures are consolidated, 2021 figures are not consolidated)
| ACEA ATO 2 - CONTRACTUAL WATER QUALITY SEGMENT | |||||||||||
|---|---|---|---|---|---|---|---|---|---|---|---|
| SPECIFIC LEVELS OF QUALITY | |||||||||||
| SERVICES | ARERA STANDARDS |
ACEA ATO 2 IMPROVEMENT STANDARD | average actual completion time for services | degree of compliance | average actual completion time for services | degree of compliance | |||||
| PERFORMANCE ACEA ATO 2 | |||||||||||
| 2020 | 2021 | ||||||||||
| estimate for water connection with inspection |
20 working days | 15 working days | 5,7 | 98,00% | 5,9 | 98,10% | |||||
| estimate for sewage connection with inspection | 20 working days | 15 working days | 3,5 | 100,00% | 3,7 | 98,70% | |||||
| execution of the water connection with simple work | 15 working days | 10 working days | 6,7 | 95,90% | 4,3 | 100,00% | |||||
| execution of the sewage connection simple work |
20 working days | 15 working days | / | / | 8,3 | 100,00% | |||||
| supply activation | 5 working days | 3 working days | 5,8 | 88,00% | 2,9 | 94,30% | |||||
| reactivation or takeover of the supply without changing the meter rate |
5 working days | 3 working days | 2,3 | 95,60% | 1,5 | 97,30% | |||||
| reactivation or takeover supply with changes to the meter rate |
10 working days | 6 working days | 2 | 100,00% | 1 | 100,00% | |||||
| reactivation of supply following disconnection for late payment |
2 working days | 1 weekday | 0,7 | 92,60% | 0,8 | 98,10% | |||||
| deactivation of supply | 7 working days | 3 working days | 3,1 | 95,70% | 2,1 | 95,90% | |||||
| transfer of registration | 5 working days | 3 working days | 0,2 | 99,60% | 0,2 | 99,50% | |||||
| estimates for works with inspection | 20 working days | 15 working days | 4,9 | 98,70% | 5,4 | 99,10% | |||||
| completion of simple work | 10 working days | 6 working days | 13,4 | 77,80% | 4,2 | 90,00% | |||||
| punctuality band for appointments | 180 minutes | 120 minutes | 0,7 | 99,00% | 0,8 | 99,20% | |||||
| reply to complaints | 30 working days | 20 working days | 6,2 | 99,50% | 5,7 | 99,70% | |||||
| reply to written enquiries | 30 working days | 20 working days | 5,6 | 99,80% | 5,4 | 99,60% | |||||
| billing adjustment | 60 working days | 55 working days | 6,3 | 100,00% | 6,9 | 100,00% | |||||
| GENERAL LEVELS OF QUALITY | |||||||||||
| ACEA ATO 2 PERFORMANCE | |||||||||||
| 2020 | 2021 | ||||||||||
| completion of complex water connection | 90% of the services within 30 working days | 90% of the services within 20 working days | 27,6 | 84,60% | 8,2 | 96,70% | |||||
| completion of complex sewage connection | 90% of the services within 30 working days | 90% of the services within 25 working days | 1 | 100,00% | 16,2 | 93,90% | |||||
| completion of complex works | 90% of the services within 30 working days | 90% of the services within 20 working days | 43,1 | 76,20% | 14,8 | 91,80% | |||||
| maximum time for the agreed appointment | 90% of the services within 7 working days | 90% of the services within 5 working days | 2,5 | 95,20% | 2,8 | 92,70% | |||||
| arrival at the location of the emergency call | 90% of the services within 3 minutes from the telephone conversation with the operator | 90% of the services within 2 minutes from the telephone conversation with the operator | 2,6 | 97,90% | 1,3 | 97,70% | |||||
| reply to written billing adjustment requests | 95% of the services within 30 working days from receipt of the request | 95% of the services within 20 working days from receipt of the request | 6,9 | 99,70% | 6 | 99,60% | |||||
| reply to the emergency call (CPI) | 90% of the services within 120 seconds | 90% of the services within 110 seconds | 55 | 96,20% | 55 | 96,80% | |||||
NOTE: the 2021 data are being consolidated and have still not been submitted to the STO or reported to ARERA. The symbol “/” is used when there are no services during the year.
Table no. 29 – The main specific and general levels of contractual quality in the water sector (2020-2021) – Acea Ato 5 – (ARERA parameters, improvement standards from the Service Charter, and Acea Ato 5 performance – 2020 figures are consolidated, 2021 figures are not consolidated)
| ACEA ATO 5 - CONTRACTUAL WATER QUALITY SEGMENT | |||||||||
|---|---|---|---|---|---|---|---|---|---|
| SPECIFIC LEVELS OF QUALITY | |||||||||
| SERVICES | ARERA STANDARDS | ACEA ATO 5 IMPROVEMENT STANDARD (from SC) |
average actual completion time for services | degree of compliance | average actual completion time for services | degree of compliance | |||
| PERFORMANCE ACEA ATO 5 | |||||||||
| 2020 | 2021 | ||||||||
| estimate for water connection with inspection | 20 working days | 10 working days | 10,8 | 72,50% | 3,6 | 98,00% | |||
| estimate for sewage connection with inspection | 20 working days | 10 working days | 18,3 | 94,50% | 7,9 | 94,10% | |||
| execution of the water connection with simple work | 15 working days | 3,1 | 100,00% | 1,9 | 99,30% | ||||
| execution of the sewage connection simple work | 20 working days | - | - | - | - | ||||
| supply activation | 5 working days | 11,2 | 55,50% | 2,9 | 97,40% | ||||
| reactivation or takeover of the supply without changing the meter rate | 5 working days | 5,2 | 73,30% | 1,4 | 98,90% | ||||
| reactivation or takeover supply with changes to the meter rate (*) |
10 working days | n.a. | n.a. | 0 | 100% | ||||
| reactivation of supply following disconnection for late payment |
2 working days | 1 | 99,50% | 0,9 | 97,30% | ||||
| deactivation of supply | 7 working days | 5 working days | 6,7 | 77,40% | 2,1 | 99,40% | |||
| transfer of registration | 5 working days | 0,4 | 99,60% | 0,1 | 99,70% | ||||
| estimates for works with inspection | 20 working days | 10,2 | 80,00% | 3,3 | 99,30% | ||||
| completion of simple work | 10 working days | - | - | 2 | 100,00% | ||||
| punctuality band for appointments | 180 minutes | 1,5 | 99,70% | 0,8 | 99,70% | ||||
| reply to complaints | 30 working days | 20 working days | 13 | 94,70% | 10 | 98,70% | |||
| reply to written enquiries | 30 working days | 10 working days | 11,4 | 97,00% | 7,9 | 99,90% | |||
| billing adjustment | 60 working days | 9 | 95,00% | 6,5 | 100,00% | ||||
| GENERAL LEVELS OF QUALITY | |||||||||
| PERFORMANCE ACEA ATO 5 | |||||||||
| 2020 | 2021 | ||||||||
| completion of complex water connection | 90% of the services within 30 working days | 90% of the services within 20 working days | 9,4 | 91,30% | 12,6 | 90,40% | |||
| completion of complex sewage connection | 90% of the services within 30 working days | 90 of the services within 20 working days | 11 | 75,00% | 21,5 | 66,70% | |||
| completion of complex works | 90% of the services within 30 working days | 11,9 | 95,60% | 11,8 | 85,70% | ||||
| maximum time for the agreed appointment | 90% of the services within 7 working days | 5,8 | 76,30% | 1,9 | 99,80% | ||||
| arrival at the location of the emergency call | 90% of the services within 3 minutes from the telephone conversation with the operator | 90% of the services within 70 minutes from the telephone conversation with the operator | 61,1 | 89,90% | 96,5 | 87,90% | |||
| reply to written billing adjustment requests | 95% of the services within 30 working days from receipt of the request | 95% of the services within 10 working days from receipt of the request | 18,3 | 74,50% | 8,8 | 98,50% | |||
| reply to the emergency call (CPI) | 90% of the services within 120 seconds | 83 | 85,80% | 105 | 80,60% | ||||
(*) In 2020 there were no services found that were the subject of a resolution.
NOTE: The symbol "-" indicates that the average time cannot be calculated because the service is on/off.
Table no. 30 – The main specific and general levels of contractual quality in the water sector (2020-2021) – GORI (ARERA parameters and GORI performance - 2020 figures are consolidated, 2021 figures are not consolidated)
| CONTRACTUAL QUALITY WATER SECTOR- GORI | |||||
|---|---|---|---|---|---|
| SPECIFIC LEVELS OF QUALITY | |||||
| SERVICES | ARERA STANDARDS |
average actual completion time for services | degree of compliance | average actual completion time for services | degree of compliance |
| PERFORMANCE GORI | |||||
| 2020 | 2021 | ||||
| estimate for water connection with inspection | 20 working days | 8,46 | 95,80% | 6,05 | 98,90% |
| estimate for sewage connection with inspection | 20 working days | 8,31 | 94,80% | 36,47 | 98,20% |
| execution of the water connection with simple work | 15 working days | 24,5 | 77,80% | 15,13 | 81,20% |
| execution of the sewage connection with simple work | 20 working days | - | - | 8.57 | 100,00% |
| supply activation | 5 working days | 13,14 | 84,50% | 4,76 | 93,40% |
| reactivation or takeover of the supply without changing the meter rate | 5 working days | 2,57 | 92,70% | 1,94 | 97,30% |
| reactivation or takeover of the supply with changes to the meter rate | 10 working days | / | / | / | / |
| reactivation of supply following disconnection for late payment | 2 working days | 0,7 | 95,30% | 2,55 | 97,40% |
| deactivation of supply | 7 working days | 4,17 | 92,20% | 3,71 | 98,60% |
| transfer of registration | 5 working days | 0,87 | 97,20% | 0,5 | 99,10% |
| estimates for works with inspection | 20 working days | 7,71 | 96,70% | 5,48 | 99,40% |
| completion of simple work | 10 working days | 11,53 | 74,40% | 17,23 | 62,50% |
| punctuality band for appointments | 180 minutes | 1,29 | 98,90% | 0,91 | 99,10% |
| reply to complaints | 30 working days | 11,72 | 91,50% | 13,9 | 85,80% |
| reply to written enquiries | 30 working days | 4,32 | 99,70% | 6,5 | 95,90% |
| billing adjustment | 60 working days | 17 | 100,00% | 1,2 | 100,00% |
| GENERAL LEVELS OF QUALITY | |||||
| PERFORMANCE GORI | |||||
| 2020 | 2021 | ||||
| completion of complex water connection | 90% of the services within 30 working days | 31,07 | 80,60% | 25,39 | 77,70% |
| completion of complex sewage connection | 90% of the services within 30 working days | 29,83 | 76,20% | 27,37 | 72,40% |
| completion of complex works | 90% of the services within 30 working days | 62 | 51,20% | 41,44 | 66,30% |
| maximum time for the agreed appointment | 90% of the services within 7 working days | 5,3 | 83,40% | 6,71 | 93,80% |
| arrival at the location of the emergency call | 90% of the services within 3 minutes from the telephone conversation with the operator | 1,44 | 96,30% | 2,04 | 98,00% |
| reply to written billing adjustment requests | 95% of the services within 30 working days from receipt of the request | 5,87 | 97,50% | 9,5 | 95,20% |
| reply to the emergency call (CPI) | 90% of the services within 120 seconds | 64,82 | 93,50% | 52 | 97,40% |
NOTE: The symbol “/” is used when there are no services during the year.
Table no. 31 – The main specific and general levels of contractual quality in the water segment (2020-2021) – GESESA (ARERA parameters, and Gesesa's performance - 2020 figures are consolidated, 2021 figures are not consolidated)
| CONTRACTUAL QUALITY WATER SECTOR - GESESA | ||||||
|---|---|---|---|---|---|---|
| SPECIFIC LEVELS OF QUALITY | ||||||
| SERVICES | ARERA STANDARDS |
average actual completion time for services | degree of compliance | average actual completion time for services | degree of compliance | |
| GESESA PERFORMANCE | ||||||
| 2020 | 2021 | |||||
| estimate for water connection with inspection | 20 working days | 3,86 | 97,10% | 5,14 | 71,30% | |
| estimate for sewage connection with inspection | 20 working days | / | / | / | / | |
| execution of the water connection with simple work | 15 working days | 21,25 | 85,20% | 4,17 | 94,40% | |
| execution of the sewage connection with simple work | 20 working days | / | / | / | / | |
| supply activation | 5 working days | 71,32 | 31,80% | 47,68 | 57,10% | |
| reactivation or takeover of the supply without changing the meter rate |
5 working days | 2,05 | 97,50% | 3,7 | 80,40% | |
| reactivation or takeover of the supply with changes to the meter rate |
10 working days | / | / | / | / | |
| reactivation of supply following disconnection for late payment | 2 working days | 16,83 | 50,00% | 91,51 | 89,30% | |
| deactivation of supply | 7 working days | 2,49 | 98,40% | 3,49 | 98,00% | |
| transfer of registration | 5 working days | 0,63 | 99,00% | 0,9 | 98,90% | |
| estimates for works with inspection | 20 working days | 3,46 | 97,40% | 3,84 | 96,40% | |
| completion of simple work | 10 working days | 2,18 | 100,00% | 2,26 | 97,10% | |
| punctuality band for appointments | 180 minutes | 57 | 97,80% | 3 | 95,40% | |
| reply to complaints | 30 working days | 11,18 | 99,80% | 9,5 | 100,00% | |
| reply to written enquiries | 30 working days | 10,21 | 99,50% | 8,8 | 100,00% | |
| billing adjustment | 60 working days | 15,96 | 98,00% | 3,3 | 100,00% | |
| GENERAL LEVELS OF QUALITY | ||||||
| GESESA PERFORMANCE | ||||||
| 2020 | 2021 | |||||
| completion of complex water connection | 90% of the services within 30 working days | 84,30% | 12,76 | 95,2 | ||
| completion of complex sewage connection | 90% of the services within 30 working days | / | / | / | / | |
| completion of complex works | 90% of the services within 30 working days | 3 | 96,40% | 2,05 | 100% | |
| maximum time for the agreed appointment | 90% of the services within 7 working days | 2,43 | 99,00% | 3,5 | 97,60% | |
| arrival at the location of the emergency call | 90% of the services within 3 minutes from the telephone conversation with the operator | 10 | 62,20% | 28,21 | 72,80% | |
| reply to written billing adjustment requests | 95% of the services within 30 working days from receipt of the request | 11,06 | 99,60% | 14,1 | 100% | |
| reply to the emergency call (CPI) | 90% of the services within 120 seconds | 84,29 | 87,50% | 86 | 88,00% | |
NOTE: The symbol “/” is used when there have been no services during the year, whereas “-” indicates that the average time cannot be calculated because the services is on/off.
Table no. 32 – The main specific and general levels of contractual quality in the water sector (2020-2021) – AdF – (ARERA parameters, improvement standards from the Service Charter, and AdF performance – 2020 figures are consolidated, 2021 figures are not consolidated)
| CONTRACTUAL QUALITY WATER SECTOR- AdF | |||||||||
|---|---|---|---|---|---|---|---|---|---|
| SPECIFIC LEVELS OF QUALITY | |||||||||
| SERVICES | ARERA STANDARDS |
AdF IMPROVEMENT STANDARD (from SC) |
average actual completion time for services | degree of compliance | average actual completion time for services | degree of compliance | |||
| AdF PERFORMANCE | |||||||||
| 2020 | 2021 | ||||||||
| estimate for water connection with inspection | 20 working days | 5,46 | 98,40% | 6,34 | 99,10% | ||||
| estimate for sewage connection with inspection | 20 working days | 5,93 | 97,90% | 6,5 | 98,90% | ||||
| execution of the water connection with simple work | 15 working days | 5,9 | 96,00% | 6,62 | 94,60% | ||||
| execution of the sewage connection simple work | 20 working days | n.a. | n.a. | n.a. | n.a. | ||||
| supply activation | 5 working days | 5,3 | 94,30% | 5,93 | 92,40% | ||||
| reactivation or takeover of the supply without changing the meter rate | 5 working days | 2,5 | 97,60% | 2,05 | 97,70% | ||||
| reactivation or takeover supply with changes to the meter rate | 10 working days | / | / | / | / | ||||
| reactivation of supply following disconnection for late payment |
2 working days | 0,71 | 97,60% | 0,85 | 97,80% | ||||
| deactivation of supply | 7 working days | 25 working days | 2,32 | 99,10% | 2,68 | 98,20% | |||
| transfer of registration | 5 working days | 0,1 | 99,90% | 0,2 | 99,90% | ||||
| estimates for works with inspection | 20 working days | 4,98 | 99,30% | 6,47 | 99,20% | ||||
| completion of simple work | 10 working days | 8,3 | 83,30% | 3,88 | 95,30% | ||||
| punctuality band for appointments | 180 minutes | 1 | 99,10% | 1,4 | 99,40% | ||||
| reply to complaints | 30 working days | 25 working days | 13,3 | 98,90% | 15,4 | 99,50% | |||
| reply to written enquiries | 30 working days | 25 working days | 13,7 | 99,40% | 15,3 | 99,50% | |||
| billing adjustment | 60 working days | 13,3 | 100,00% | 11,7 | 100,00% | ||||
| GENERAL LEVELS OF QUALITY | |||||||||
| AdF PERFORMANCE | |||||||||
| 2020 | 2021 | ||||||||
| completion of complex water connection | 90% of the services within 30 working days | 14,2 | 93,60% | 13,8 | 93,20% | ||||
| completion of complex sewage connection | 90% of the services within 30 working days | 21,7 | 90,50% | 28,4 | 76,70% | ||||
| completion of complex works | 90% of the services within 30 working days | 15,5 | 94,20% | 13,9 | 90,50% | ||||
| maximum time for the agreed appointment | 90% of the services within 7 working days | 3 | 99,80% | 3,3 | 97,60% | ||||
| arrival at the location of the emergency call | 90% of the services within 3 minutes from the telephone conversation with the operator | 6 | 95,10% | 1,5 | 94,70% | ||||
| reply to written billing adjustment requests | 95% of the services within 30 working days from receipt of the request | 15,8 | 100,00% | 17,4 | 99,90% | ||||
| reply to the emergency call (CPI) | 90% of the services within 120 seconds | 50 | 95,20% | 43 | 97,50% | ||||
NOTE: The symbol “/” is used when there are no services during the year.
49Areti holds the ministerial concession for the distribution of electricity in the areas indicated and manages public lighting under the Service Contract stipulated between Acea
SpA and Roma Capitale.
50Prosumers are both consumers and producers of energy, which they use for their own consumption or sell to the grid (see the box on prosumers connected to Acea's networks, which are constantly increasing, in the section on Acea Group customers: electricity and water services.
51Areti’s Resilience Plan was submitted to ARERA in June 2019.
52By Resolution of the City Council No. 130 dated 22 December 2010 regarding the Updating of the Service Agreement between Roma Capitale and Acea SpA, effective 15 March 2011, the agreement was extended to 31/12/2027.
53For the purpose of calculating service levels, reports pertaining to damages caused by third parties are not be considered.
54The calculation of penalties is based on the following criteria: any repair carried out beyond TMAX is penalised; those carried out with times below TMAX but above TMRA are only penalised if TMR>TMRA. At the time of publication of this document the data is not yet definitive, therefore the accurate data on 2020 reports subject to fines being calculated is not available
55More detailed information on call centre performance and written complaints is provided in the Customer Care section..
56The data excludes reminders and repeated reporting of the same fault.
57Specific quality standards” are defined as the deadline within which the service provider must provide a given service and, in the event of non-compliance, they require that automatic compensation is granted to customers; the general quality standards” are defined as the minimum percentage of services to be provided within a given deadline.
58Integrated Test on the output-based regulation of electricity distribution and measurement services – Annex A to ARERA resolution 646/2015/R/eel as subsequently amended and supplemented.
59This is due to the misalignment between the delivery times of reports to the Authority and those required by law for the publication of this document.
60Where due, automatic compensation is paid to the customer by deduction from the amount charged in the first subsequent bill and if needed in following bills, or paid by direct remittance. In any case, such automatic compensation must always be paid to the customer within 6 months from the date of receipt of the written complaint or the request for reimbursement of double billing, with the exception of customers who are billed quarterly, for which the term is set at 8 months. For distribution activities, automatic compensation is paid by the distributor to the service recipient within 7 months from the date on which the required service is provided.
61The amount set by the Authority for compensation for non-compliance with the specific quality standards for the distribution service starts from a basic amount of € 35 for domestic low voltage customers; € 70 for non-domestic low voltage customers and € 140 for medium voltage customers. In the event of non-compliance with the specific quality standards of the sale, the seller shall pay the final customer an automatic compensation of € 25. Compensation grows in relation to the delay in the provision of the service.
62In order to be entitled to compensation, medium voltage customers must prove that they have installed protection devices at their plants that can prevent any interruption caused by faults in their utility plants from having repercussions on the Areti network, damaging other customers connected nearby. Furthermore, they must send their own plant adequacy statement, issued by parties with specific technical and professional expertise. Where customers fail to meet the requirements whereby compensation may be sought, that amount is paid by Areti as a fine to the Energy and Environmental Services Fund.
63In July 2021, with Regional Council Resolution No. 10, the Optimal Territorial Area 2 - Central Lazio-Rome was modified to include the Municipality of Campagnano di Roma, which previously belonged to ATO 1 - North Lazio-Viterbo.
64In 80 municipalities, equal to about 94% of the population in OTA 2 – Central Lazio, Acea Ato 2 managed the entire IWS (aqueduct, sewerage and waste water treatment), and the IWS was partially managed in another 17 municipalities.
65Acea was entrusted with the running of the capital’s aqueduct service since 1937, the water treatment system since 1985 and the entire sewerage system since 2002, effective 1 January 2003.
66Including the management of two municipalities outside the area (Conca Casale and Rocca d’Evandro).
67These are the "New Marcio Aqueduct - Lot I", the "Raddoppio VIII Syphon - Casa Valeria Section - Ripoli Tunnel Exit - Phase I", the "Ottavia - Trionfale Supply System" and the "Monte Castellone - Colle S. Angelo (Valmontone) Pipeline.
68The figure, although significant, is certainly underestimated because it does not take into account the emission savings induced by not transporting the bottles by road/rail.
69Consumption data of the AdF water kiosks managed by the municipalities are not available.
70For most of the services the regulation of contractual quality aspects is in force from July 2016 according to resolution 655/15/R/Idr or RQSII (Regulation of the contractual
quality of the integrated water service).
71Contractual quality premiums related to the achievement of improved quality standards with respect to those defined in Resolution 655/2015/R/IDR were introduced by
Resolution 664/2015/R/Idr on the Integrated Water Service Tariff Method for the second regulatory period (2016-2019).